Creating Custom Reports Using Core UI
Creating a Relation
In order to create custom reports for Experience Builder using the xbUI widget, the correct expression needs to be added to the Web Viewer of the Experience Builder project.
Open the Map Viewer, and select the Layer that will have the expression applied to it. In this example, the “TaxParcelPrimary” layer will be used.

Once the layer we would like to use is determined, select the “Pop-ups” icon on the right (1).
Then, under the Fields list, select “Add content” (2). Then select “Arcade” (3).

Once that is selected, we can now add our expression. There will be a default expression within the Map Viewer, we can delete that.

First, we need to add the expression that will allow for relatons.
The expression will be:
{
     "type" : "XBTOOLS",
     "spatial" : {
         "type" : "XBUISpatial",
         "template": "address1",
         "label": "Addresses",
         "sqlsource" : "Address Points",
         "sqlwhere": "1=1"
     }
}
Inside the spatial block:
"type": "XBUISpatial"- This sets the type of tool. "XBUISpatial" is a custom tool built for
interacting with spaƟal features (e.g., selecting points on a map)
- This sets the type of tool. "XBUISpatial" is a custom tool built for
"template": "address1"- This refers to a predefined layout or format for this tool.
"label": "Addresses"- This is the UI label for this tool—how it appears in the app.
"sqlsource": "Address Points"- This specifies the data source. Which is another feature layer
within our map labeled “Address Points”. It is the source of the spaƟal features the tool interacts with.
- This specifies the data source. Which is another feature layer
"sqlwhere": "1=1"- This is a basic SQL WHERE clause. "1=1" is a trick to select all records, acƟng
like a default catch-all filter (i.e., no filtering applied).
- This is a basic SQL WHERE clause. "1=1" is a trick to select all records, acƟng
Once we have our expression in place, the “Done” button on the lower right-hand side should be
available. If not, there is an error with the expression.
Now that we have our expression in place, make sure we save our Map Viewer and now we can jump into our Experience Builder project.
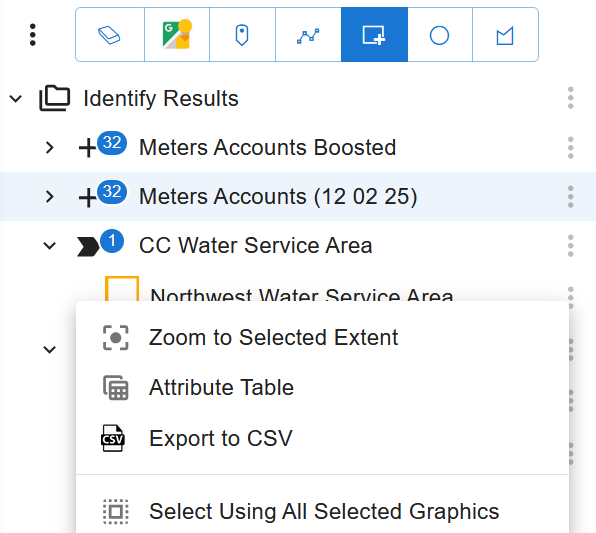
In this example, we will select multiple parcels under the “TaxParcelPrimary” layer and populate that selection into the Identify panel. As we expand one of the features selected, we will now notice that there is a related feature attached to our selected feature.
We told our xbUI tool that, when we select a feature under the “TaxParcelPrimary” feature layer, we want the “AddressPoint” feature related to our selected feature to be attached as well. This gives us the ability to view attributes not only of our selected feature, but the related feature as well. 
Customizing Export Template
Now that we have established how to create a relate between two features within our Experience
Builder project, we will now go over how to create an Export Template.
We will go back into our project’s Map Viewer and jump back into our Arcade Expression builder.
This time, we will delete the last bracket, add a “,” and add the following:
"exporttemplate":[
  {
    "category": "PDF",
    "type": "AVERY",
    "name": "Related Records (Address Points)",
    "outputfile": "Related.pdf",
    "userelated": true,
    "layout": {
      "marginleft": 0.15,
      "margintop": 0.6,
      "fontheight": 12,
      "showborder": true,
      "indent": 0.125,
      "maxcharacters": 35,
      "distinct": true,
      "content": [
        {
          "type": "expression",
          "text": "'Occupant' + TextFormatting.NewLine + $feature.HouseNum + ' ' + $feature.AbbreviatedName
                      + TextFormatting.NewLine + $feature.ZipMunicipality + ', ' + $feature.FIPsState
                      + ' ' + $feature.ZIPCode", "justification": "left"
        }]
      }
    },
    {
      "category": "PDF",
      "type": "ATT",
      "name": "Attributes Only (table)",
      "outpuƞile": "Attributes.pdf",
      "usepopup": true,
      "title": "Map title set in template",
      "layout": {
        "tabledisplay": true,
        "fields": [
          "OBJECTID",
          "PARCELNO"
        ]
      }
    }
  ]
}
Section 1: Exporting Avery Labels
This section establishes the parameters for exporting a PDF document specifically formatted for Avery Label sheets.
-
"category": "PDF": Instructs the system to generate a PDF document. -
"type": "AVERY": Sets the layout to a standard Avery label sheet format. -
"userelated": true: Pulls data from related records (e.g., a related table linked to a parcel or feature). -
"outputfile": "Related.pdf": Defines the name of the generated PDF file.
Layout Configuration
After defining the export type, the layout settings control the physical appearance of the labels:
-
"marginleft": 0.15and"margintop": 0.6: Sets the page offsets. -
"fontheight": 12: Sets the text size. -
"showborder": true: Draws a border around each label (useful for testing alignment). -
"indent": 0.125: Adds internal spacing within the label. -
"maxcharacters": 35: Limits text length on each label to prevent clipping. -
"distinct": true: Prevents the generation of duplicate labels. -
"content": Uses an Arcade expression to dynamically build the label text using attributes likeHouseNum,AbbreviatedName, andZipMunicipality.
Section 2: Attribute Table Export
This section provides a template for exporting feature attributes within an Experience Builder project. It creates a simple, tabular PDF without spatial layouts.
-
"category": "PDF": Target format remains a PDF. -
"type": "ATT": Specifies an Attributes Only table export. -
"name": "Attributes Only (table)": The display name for this export option. -
"outputfile": "Attributes.pdf": The filename for the resulting table. -
"usepopup": true: Inherits the configuration from the Map Viewer popup, honoring the field aliases and formatting you've already defined. -
"title": "Map title set in template": Sets the header title for the PDF. -
"tabledisplay": true: Confirms the data should be rendered in a grid/table format. -
"fields": ["OBJECTID", "PARCELNO"]: Explicitly defines which fields to include (in this case, Object ID and Parcel Number).
Next Steps
Once your expressions and JSON configurations are in place, click the Done button, Save your Map Viewer, and then proceed to Experience Builder to implement the widget.
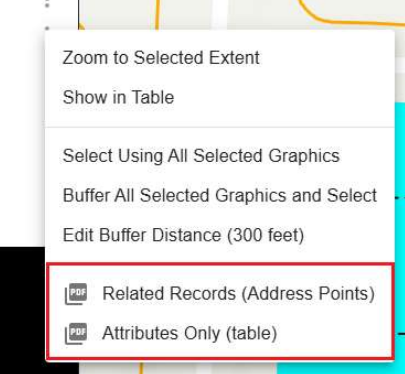
If all was done correctly, we can create a selection, populate our Identify panel and this time, we will hit the three dots adjacent to the parent layer we have selected. This is where we will find options to export our selection as either “Related” or “AƩributes Only” PDFs.


More XUI Resources...